Quality score: Why it’s impossible to project ‘above average’ CTRs
By Brad | 0 comments August 11, 2016
Categories
We’re often asked questions such as “I have a 44% CTR, why does Google say my expected CTR is average”.
Now, 44% is high, and that’s for a brand term. However, we see accounts where non-brand needs at least a 15% CTR to be ‘above average’.
Expected CTR is a major component of quality score, which makes it a primary testing metric. Although, I’d argue Conversion per Impression testing increases quality scores and profits. Regardless of your testing metric, understanding expected CTR is important to raising your quality scores.
The charts below show CTR by quality score. Both charts contain keywords with mostly above-average expected CTRs. This is data at the campaign level, so some keywords in the campaign need slightly higher or lower CTRs to hit the ‘above average’ score.
To receive a 9 or 10 for the non-brand, this company needs a 9% CTR.
To receive a 10 for their brand term, they need a 46% CTR.

In fact, for their top non-brand terms, this is what they receive:
- 3.5% CTR: below average
- 8.5% CTR: average
- 14.5% CTR: above average
For their brand terms, this is what they receive:
- 6% CTR: below average
- 15% CTR: average
- 46% CTR: Above average
Now, if we turn to a different company, for their brand terms, they only need to hit a 15% CTR to be above average.

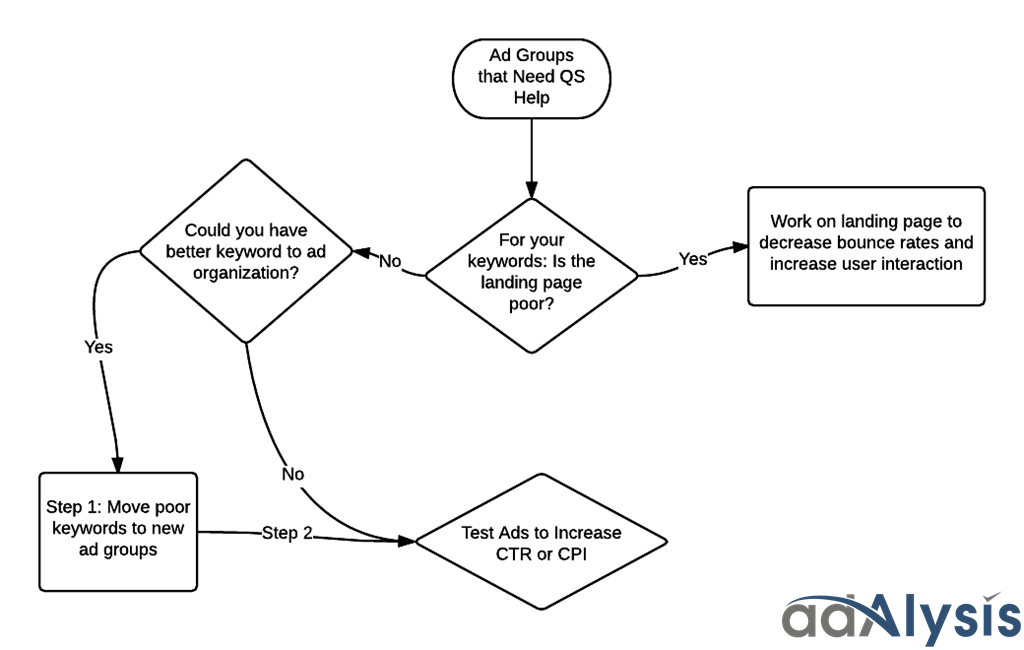
As CTRs vary so much by brand, industry, and commercial user intent that it’s impossible to say what CTR you need to hit to be considered above average for any keyword.
The best you can do is identify areas of low quality scores and then test the ads to try to increase your CTRs.
Find out more:
Share around the web


Related posts
View all
When to pause exact match and rely on broadmatch instead
When to pause exact match and rely on broad match instead
The hidden challenges of AI Max searchterm reporting
The hidden challenges of AI Max search term reporting


Leave a comment